Is it a sad fact, but true, that in Australia a student's background greatly influences how well they will do at school. Whether their parents went to university, work as professionals, or whether they live in a rural area or are indigenous, all help to predict a student's performance. And more so in Australia than in many other countries.
According to international test results, indigenous students are three and a half years of schooling behind well-off students, students from remote areas are three years behind, and poorer Australian students are about two and a half years behind their advantaged counterparts in reading, mathematics and science.
This means that when parents, or the media, examine the NAPLAN results of schools, available on the government's My School website, some careful thought is needed. Test results give a one-day snapshot of the performance of students (or average performance of all students at a school, as published on My School). They can tell us where students are, but do not tell us where students have been, where they started, or how far they have come.
And because the playing field is not level – a student's background dictates their starting point – a school's results make no sense without knowing the background of their students.
Comparing schools with My School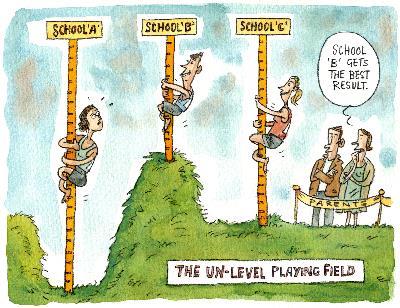
The My School website carefully takes students' backgrounds into account when the 'similar schools' feature is used to compare the performance of one school with others. The website uses a complex measure of student advantage/disadvantage called the Index of Community Socio-Educational Advantage (ICSEA) which was created specifically to enable fairer comparisons of different schools in Australia. The value of a school's ICSEA score represents the influence of educational advantage at the school and takes into account both student-level factors (parents' occupation and education) and school-level factors (geographical location and the proportion of indigenous students).
The website will only compare schools with a similar ICSEA scores, so comparing your school's average results on My School using their 'similar schools' feature is widely regarded as a valid comparison (although parents should still be mindful of factors which could affect the school's average results, such as a high proportion of special needs students, a small year-group and so on).
We rang the My School website parent information line and asked about compiling league tables of schools.
"We don't endorse that at all," the help-line attendant told me. "We use lots of methods and calculations to make valid comparisons only between schools where the kids have similar backgrounds."
"It's not fair, comparing schools with different backgrounds," he told me. "It just isn't fair."
Misleading league tables
This is, however, exactly what The Canberra Times does every March after NAPLAN data becomes available on My School. They compile and print a list of all schools ranked by average NAPLAN score, regardless of the schools having very different student populations. You can see how different the studentpopulations are at a sample of ACT schools in Table 1.
According to ACARA, who run the My School website, "simple 'league tables' that rank and compare schools with very different student populations can be misleading."
So what we see when The Canberra Times publishes its annual league table of Canberra schools is largely a table of advantage and disadvantage. Indeed, last year the paper published, along-side the school league tables, a list of schools and their ISCEA score which, unsurprisingly, closely mirrored the list of test results.
Council regards the practice of publishing school league tables as extremely misleading, unfair and potentially demoralising to schools with high levels of disadvantage. Council urges parents look at them very sceptically, and appreciate the role which student background plays.
Public versus private
Public schools educate a disproportionate number of disadvantaged students. In fact, government schools have almost twice as many students from low income families as they have from high income families, while independent private schools have twice as many students from high income families as they have from low income families. Because of this, the average test results of public schools are, as you would expect, often lower than private schools.
Canberra Grammar School regularly tops the ACT league tables, but this is to be expected, given the background of their student population, which is not at all typical of the ACT population. Canberra Grammar educates no students from the 'bottom quarter' of My School's scale of advantage, and a staggering 85% of students are from the most advantaged quarter of the community (Australian average is 25% of students in each quarter).
Richardson Primary School, which often appears towards the bottom of The Canberra Times' tables, has a very different student make-up. Half of their students are in the 'bottom quarter' of the My School scale of advantage, while only 5% of their students are in the most advantaged quarter.
So when The Canberra Times prints a headline such as last year's: Independent schools a point or two above the pack in My School rankings, they have missed the point completely. The difference in the results of independent schools is entirely accounted for by the background of their students.
In fact, several academic studies and careful analysis in the past year have shown that, once the difference in student backgrounds are taken into account, there are no significant differences between the results of Independent and public schools in the ACT (and across Australia for most groups of students). That is to say, independent schools' higher average test results are entirely accounted for by the high-advantage students who attend the schools, bringing their advantage with them; rather than a property of the school environment or teaching approach.
"Our study shows that the often-presumed better results of private schools are a myth," says Trevor Cobbold, national convenor of the Save Our Schools group and former Productivity Commission economist.
"Public schools are the equal of private schools. Public, Catholic and independent schools with a similar socio-economic composition have very similar results in nearly all states and the ACT."
Council also believes that a mix of children from different social backgrounds is beneficial for all students, including for those from advantaged backgrounds, and leads to greater social cohesion – an idea backed up by international studies.
Getting a clear picture
It's not as simple as public versus private, either. For example, it is clear from Table 1 that Garran Primary School (a public school), has a highly advantaged population, rather similar to Canberra Grammar's. It is, therefore, not meaningful to compare results at Garran with many other ACT public schools. Conversely, St Francis of Assisi Primary School (a private Catholic school) has a population which is more evenly distributed across the categories of advantage and disadvantage (see Table 1) and so is most fairly compared to schools with a similar population, rather than being compared with the majority of other private schools.
All of this means that great care is needed when comparing schools and simple league table lists of schools by average test scores should be ignored.
So, if you are looking to compare your school with others this year, don't seek out a league table from the media – the picture will not be clear at all. The My School website does a better job, but ultimately it is worth considering why we, as parents, feel the need to compare schools, when the measure which counts most is right before us: our own child's progress, from wherever it is they started.
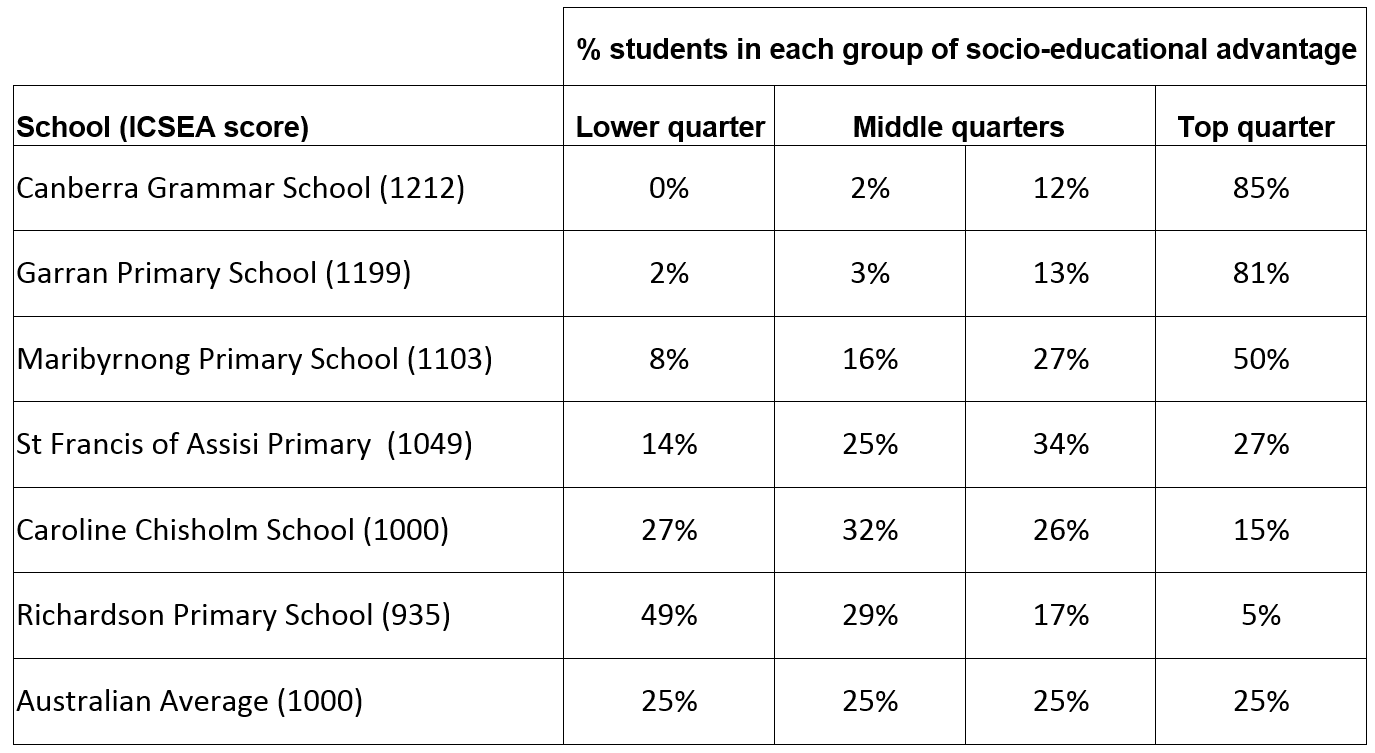
Table 1.
Very different student populations.
Shown is the distribution of students over four groups of socio-educational advantage at six ACT schools. Clearly, with such different populations, comparisons between the results of these schools would be invalid. (Data from myschool.edu.au)
Help us end the publishing of league tables. Please write a letter to The Canberra Times to complain about the misleading practice.
This article appeared in ParentACTion, Term 1, 2015. See other past editions of our quarterly magazine.